CI/CD analytics (FREE ALL)
Use the CI/CD analytics page to view pipeline success rates and duration, and the history of DORA metrics over time.
Pipeline success and duration charts
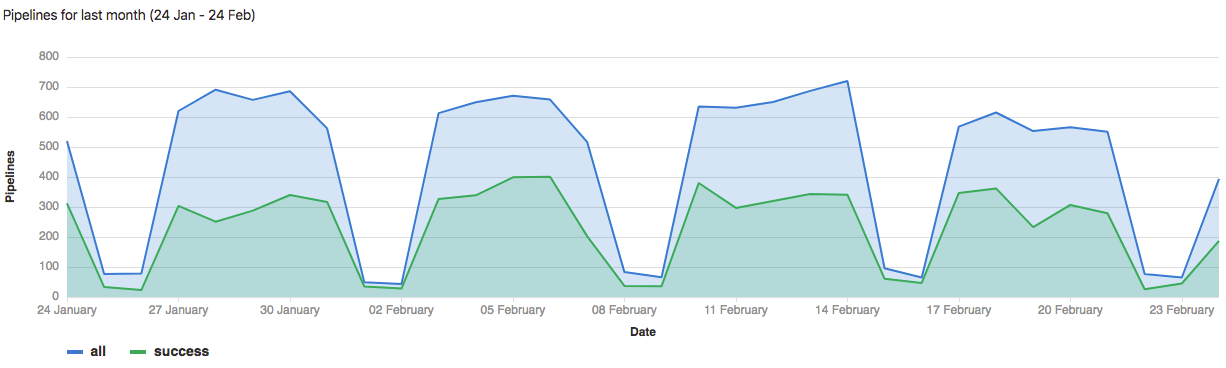
CI/CD analytics shows the history of your pipeline successes and failures, as well as how long each pipeline ran.
Pipeline statistics are gathered by collecting all available pipelines for the project, regardless of status. The data available for each individual day is based on when the pipeline was created.
The total pipeline calculation includes child pipelines and pipelines that failed with an invalid YAML. To filter pipelines based on other attributes, use the Pipelines API.
View successful pipelines:
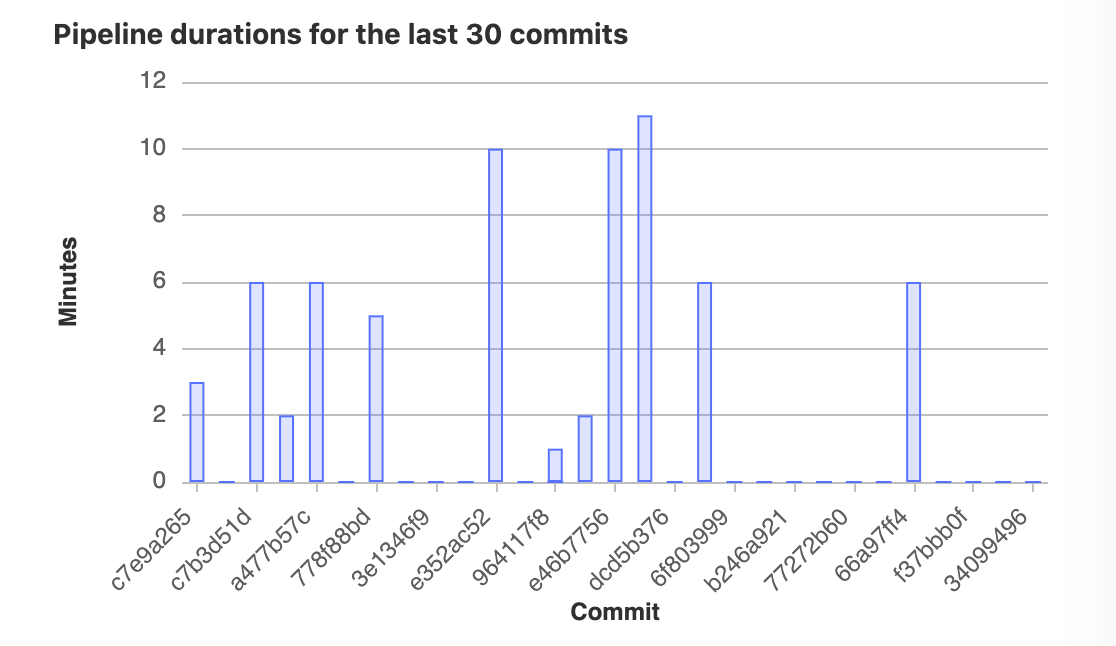
View pipeline duration history:
View CI/CD analytics
You can view CI/CD analytics for a group or project.
For a group (ULTIMATE ALL)
To view CI/CD analytics:
- On the left sidebar, select Search or go to and find your group.
- Select Analyze > CI/CD analytics.
For a project (FREE ALL)
To view CI/CD analytics:
- On the left sidebar, select Search or go to and find your project.
- Select Analyze > CI/CD analytics.
View DORA deployment frequency chart (ULTIMATE ALL)
Introduced in GitLab 13.8.
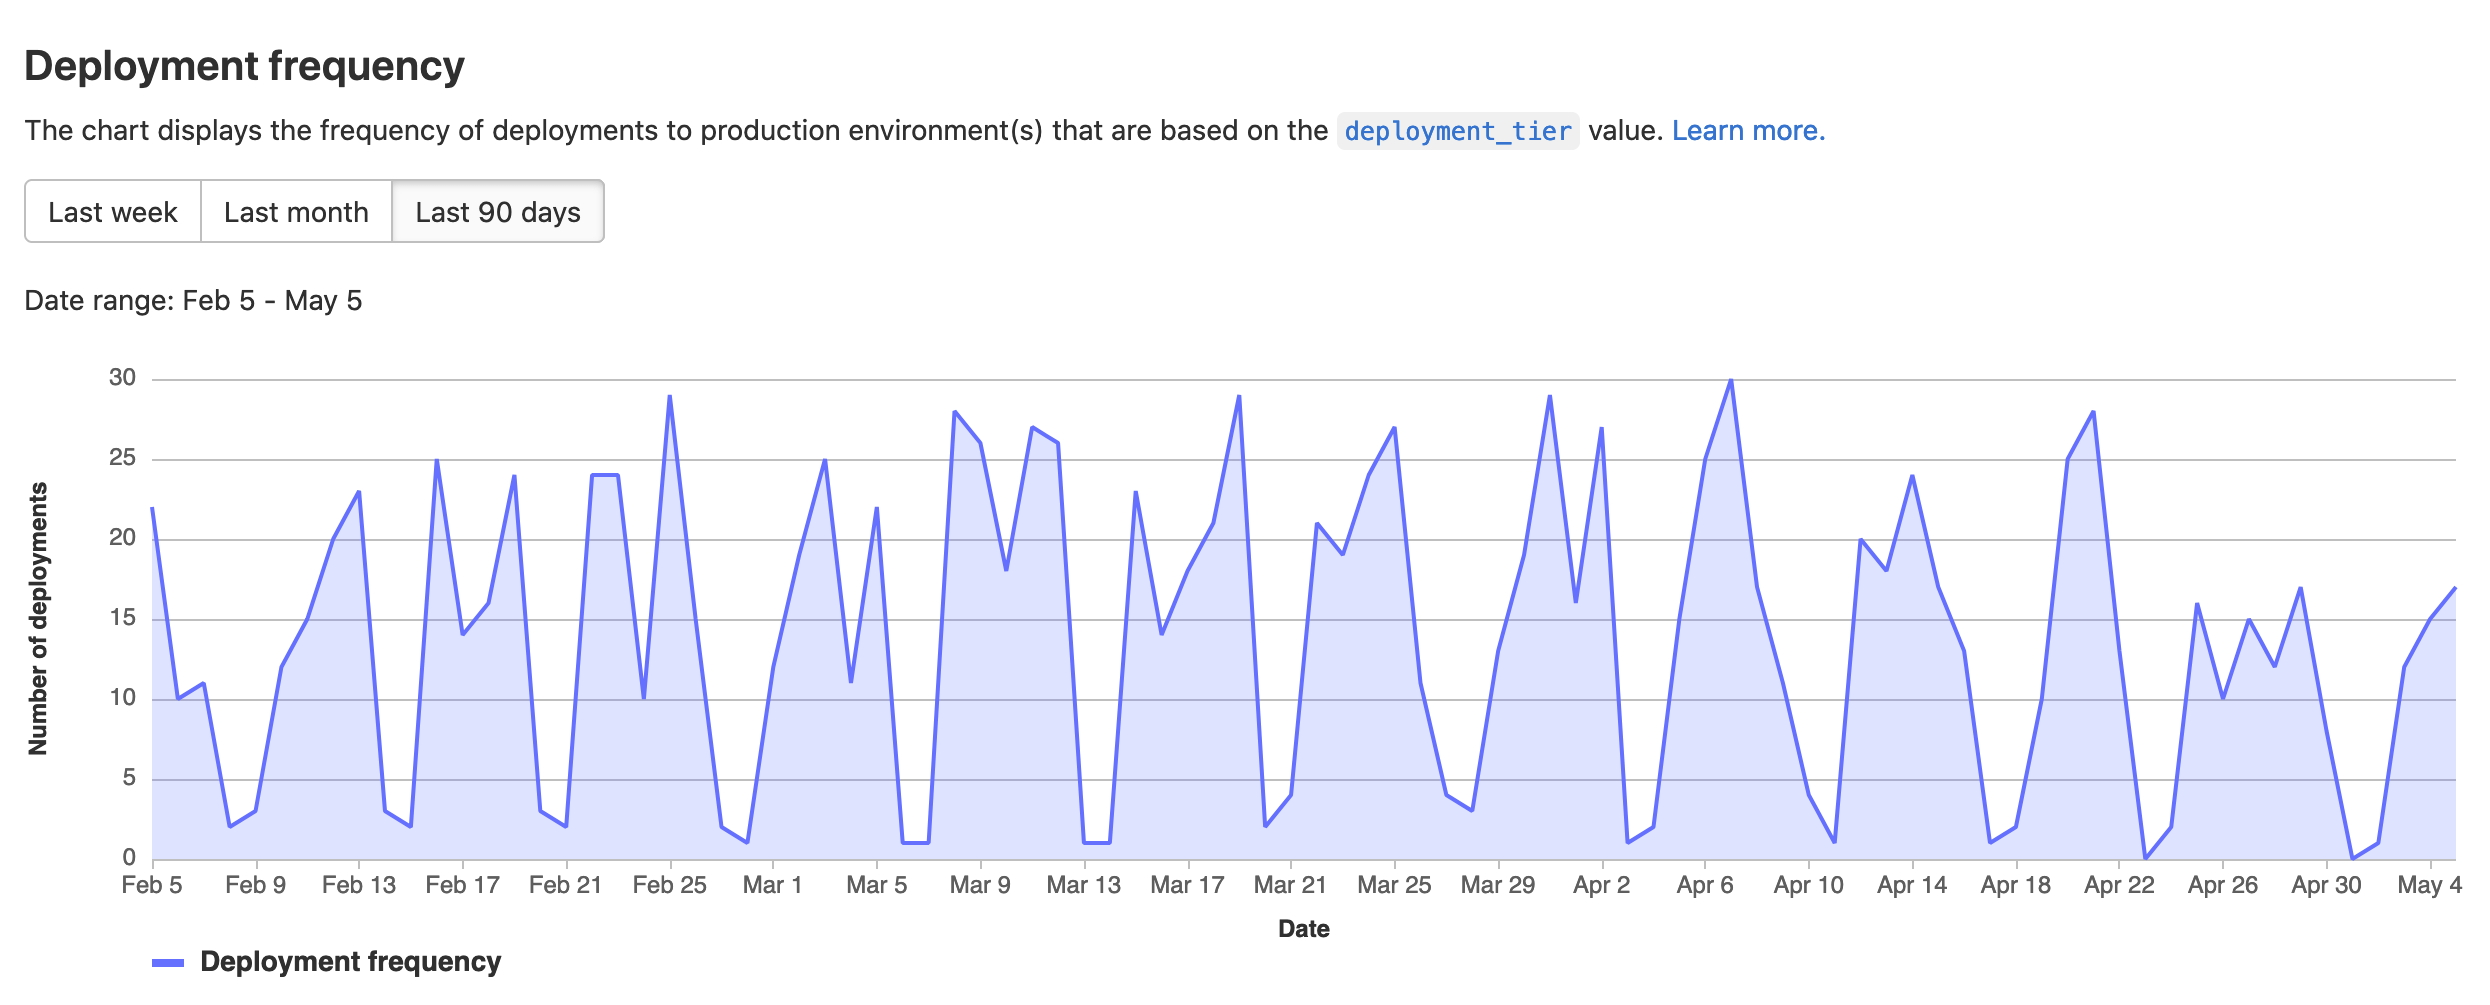
The deployment frequency charts show information about the deployment
frequency to the production environment. The environment must be part of the
production deployment tier
for its deployment information to appear on the graphs.
Deployment frequency is one of the four DORA metrics that DevOps teams use for measuring excellence in software delivery.
The deployment frequency chart is available for groups and projects.
To view the deployment frequency chart:
- On the left sidebar, select Search or go to and find your project.
- Select Analyze > CI/CD analytics.
- Select the Deployment frequency tab.
View DORA lead time for changes chart (ULTIMATE ALL)
Introduced in GitLab 13.11.
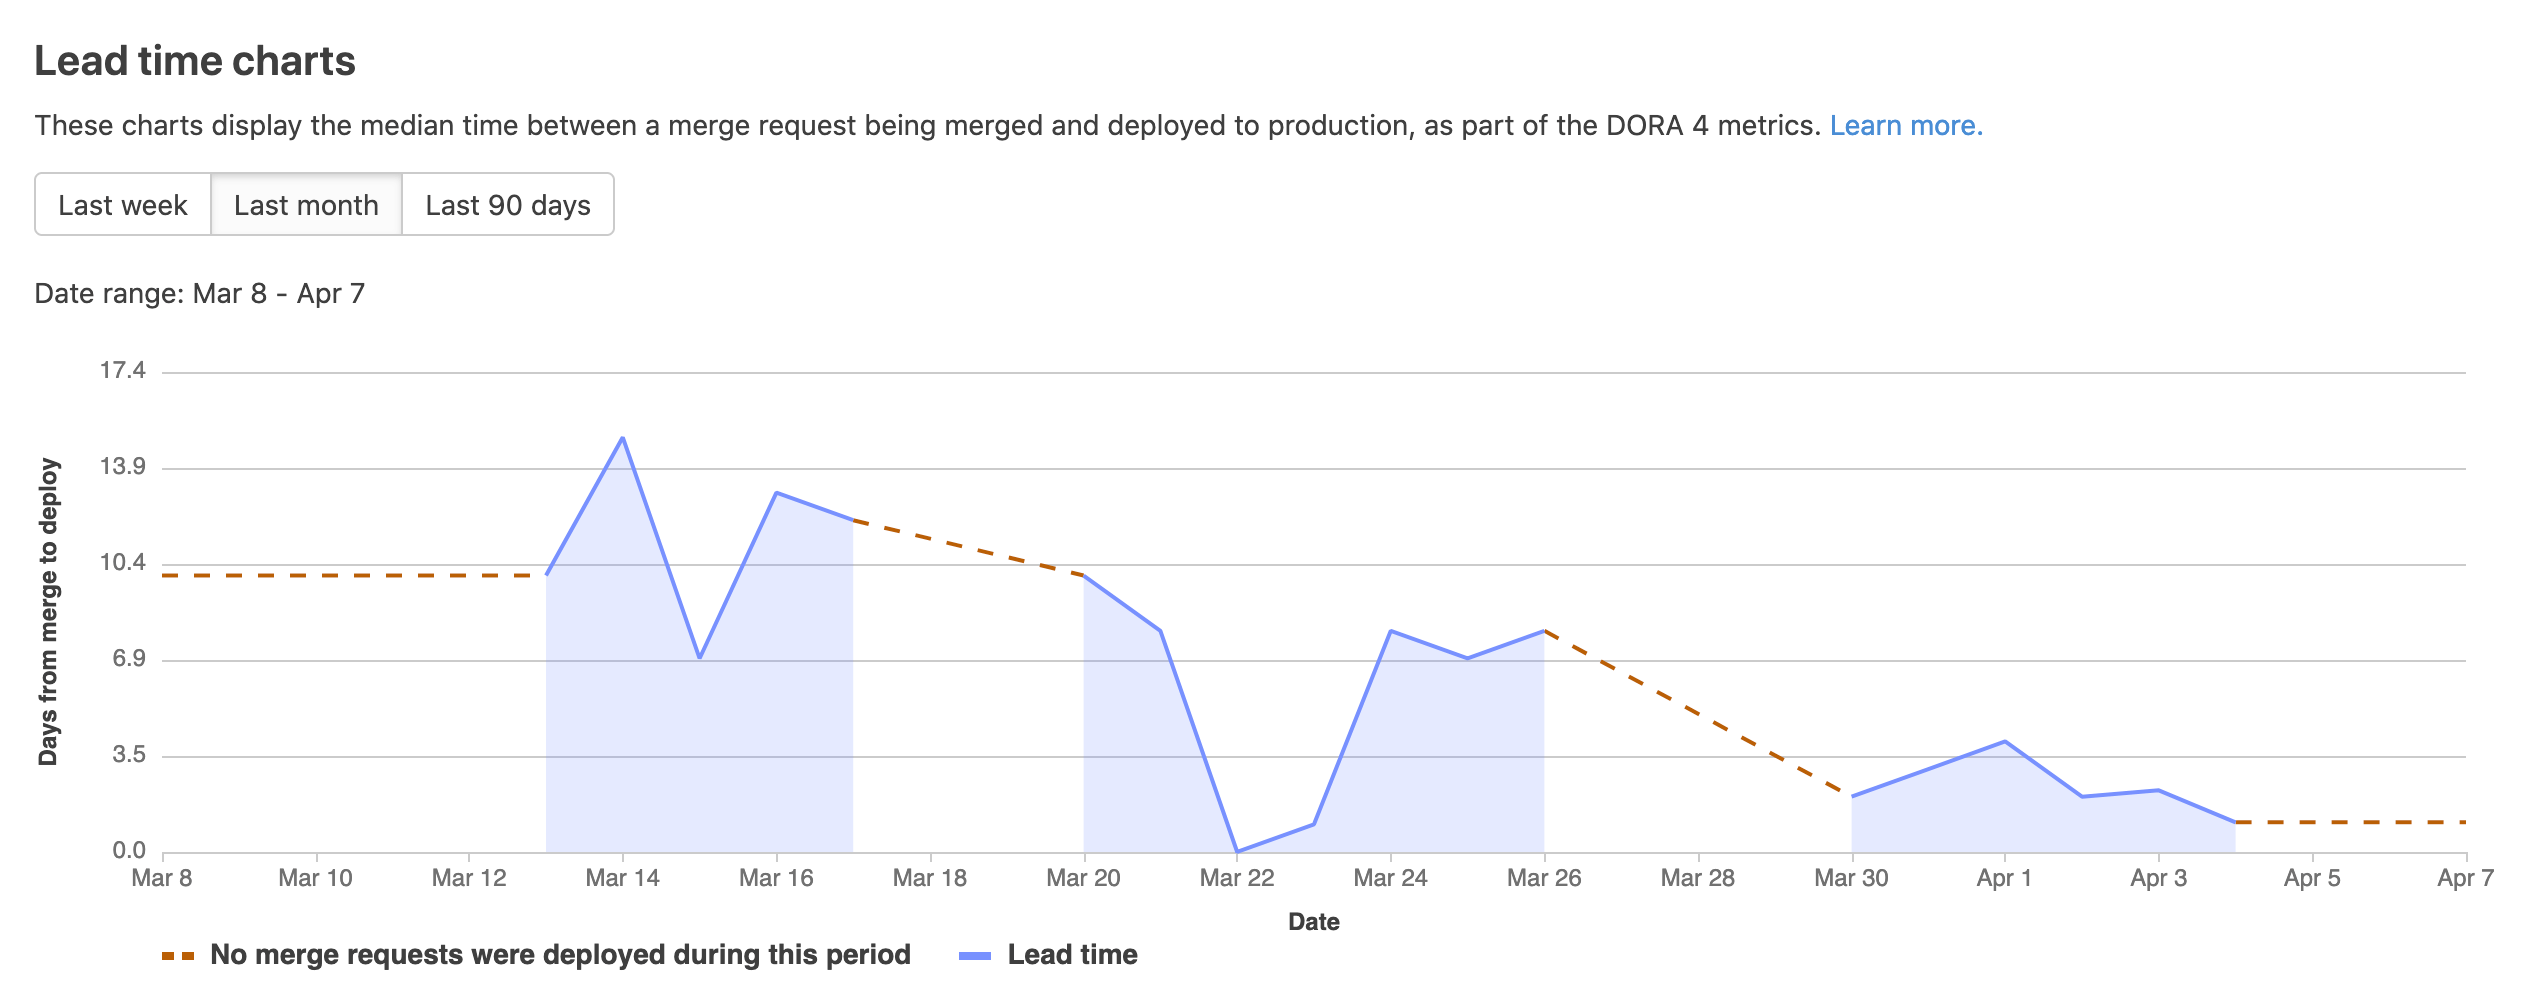
The lead time for changes chart shows information about how long it takes for merge requests to be deployed to a production environment. This chart is available for groups and projects.
- Small lead times indicate fast, efficient deployment processes.
- For time periods in which no merge requests were deployed, the charts render a red, dashed line.
Lead time for changes is one of the four DORA metrics that DevOps teams use for measuring excellence in software delivery.
To view the lead time for changes chart:
- On the left sidebar, select Search or go to and find your project.
- Select Analyze > CI/CD analytics.
- Select the Lead time tab.
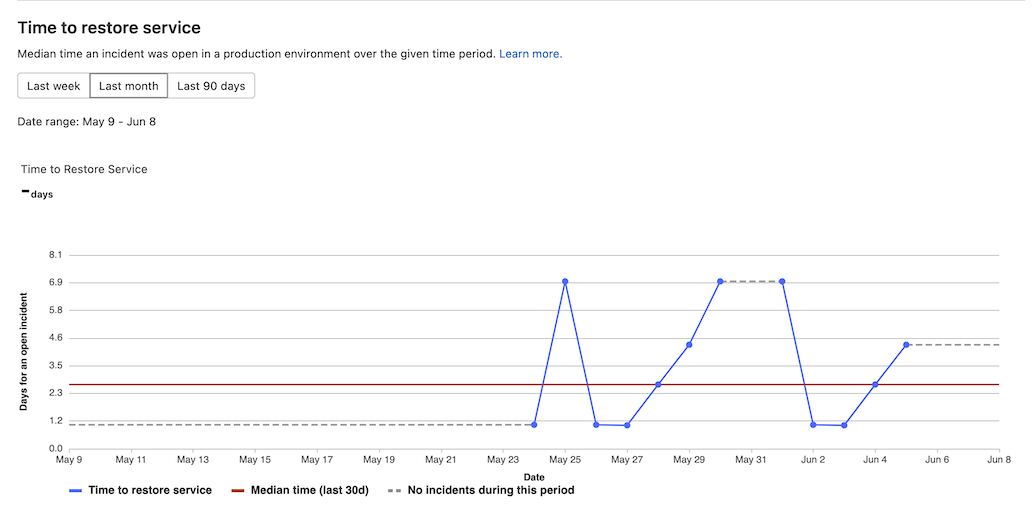
View DORA time to restore service chart (ULTIMATE ALL)
Introduced in GitLab 15.1
The time to restore service chart shows information about the median time an incident was open in a production environment. This chart is available for groups and projects.
Time to restore service is one of the four DORA metrics that DevOps teams use for measuring excellence in software delivery.
To view the time to restore service chart:
- On the left sidebar, select Search or go to and find your project.
- Select Analyze > CI/CD analytics.
- Select the Time to restore service tab.
View DORA change failure rate chart (ULTIMATE ALL)
Introduced in GitLab 15.2
The change failure rate chart shows information about the percentage of deployments that cause an incident in a production environment. This chart is available for groups and projects.
Change failure rate is one of the four DORA metrics that DevOps teams use for measuring excellence in software delivery.
To view the change failure rate chart:
- On the left sidebar, select Search or go to and find your project.
- Select Analyze > CI/CD analytics.
- Select the Change failure rate tab.